8 minute read · Original practice exercise included
Before you start: Read cost, schedule and completion measurement.
Read the lesson Explore tools and references
Next: NPV, IRR and payback
Watch this lesson
Earned value
Watch on YouTubeOpen the methods playlist
YouTube connects when you play a video or follow its links. Playback depends on the video’s availability on YouTube. Its own privacy and storage practices then apply. Voices are AI-generated.
See the calculation
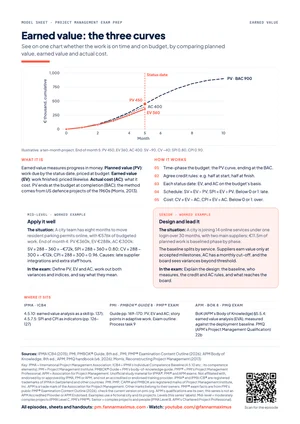
The lecture’s ten-month example, at the end of month five: BAC €900,000; PV €450,000; EV €360,000; AC €400,000. A single snapshot cannot establish a historical curve.
Scroll sideways to see the full chart. Exact values are available in the chart data below.
Read the chart data
| Status | PV (€) | EV (€) | AC (€) | CV (€) | SV (€) | CPI | SPI |
|---|---|---|---|---|---|---|---|
| Current | 450,000 | 360,000 | 400,000 | -40,000 | -90,000 | 0.9 | 0.8 |
Tools and references for this lesson
Use these resources to practise and extend the topic. Further applications may go beyond the lesson transcript; source pointers lead to the original author or publisher.
Calculators (1)
- Earned schedule
Translate earned value into equivalent baseline time. · Calculator + guide
Conceptual models (2)
- Earned value forecasting
Earned-value forecasts estimate final cost under stated assumptions about the efficiency of remaining work. Several forecasts can be useful precisely because their assumptions differ. · Guide
- Earned value: progress and cost
Earned value compares the budgeted value of completed work with planned work and actual cost at the same status date. · Guide
Formulas (8)
- Cost performance index
Measure the budgeted value earned per unit of actual cost. · Guide
- Cost variance
Compare the budgeted value of completed work with what that work actually cost. · Guide
- Estimate at completion
Forecast final cost assuming the cost efficiency observed so far continues. · Guide
- Estimate to complete
Separate forecast spending still to come from money already spent. · Guide
- Schedule performance index
Measure the amount of budgeted work earned relative to what was planned by the status date. · Guide
- Schedule variance
Compare completed work with the work planned by a status date, expressed in budget units. · Guide
- Variance at completion
Show the difference between the work budget and the forecast final cost. · Guide
- To-complete performance index
Calculate the cost efficiency required on the remaining work to finish within the original work budget. · Guide
Step-by-step methods (1)
- Build and challenge an earned-value forecast
First validate the baseline and actual costs. Then choose the forecast assumption that fits the remaining work, rather than the number that best fits the budget. · Calculator + guide
Further applications (2)
- Measuring physical completion
Define observable evidence for crediting completed work. · Guide
- Variance thresholds and trends
Set explicit triggers for investigating a departure from an agreed baseline. · Guide
Check your understanding
EV is 360,000 and AC is 400,000. What is CPI, and can it establish the finish date?
Show answer and reasoning
CPI = 360,000 ÷ 400,000 = 0.90. It describes cost efficiency on a consistent measurement basis. It does not establish a completion date; inspect dependencies and the schedule.
Apply the same reasoning to your own example. State one assumption you would need to check.
Chapters
Jump to the corresponding passage in the transcript.
Study materials
Open the original practice sheet · print or save as PDF
Anki package not yet available.
Key terms
The series’ own explanations. Official sources and edition pointers are below.
- Planned value, earned value, actual cost
- PV: the budget of the work planned by the status date. EV: the budget of the work really done. AC: what the done work cost, counted the way the budget was.
- SPI and CPI
- The schedule and cost performance indices: EV ÷ PV and EV ÷ AC. Below 1 means behind schedule, or over budget. APM reads the SPI as productivity.
- Estimate at completion (EAC)
- The forecast total cost. Each common formula rests on an assumption, for example that the cost efficiency so far continues: BAC ÷ CPI.
- To-complete performance index (TCPI)
- The cost efficiency the remaining work needs to meet a target: the work left, BAC − EV, divided by the money left, BAC − AC (or EAC − AC once a new EAC is approved).
- Measurement baseline
- The approved plan of scope, schedule and cost that progress is measured against. PMI®: performance measurement baseline. APM: deployment baseline.
- Thresholds and tolerances
- How far a measure may drift before someone must act or escalate. PMI®: control thresholds. APM: tolerances. The ICB4 asks you to signal cost breaches.
About the lesson’s level labels
Levels (this series' labels): Mid-level = moderately complex projects (IPMA Level C, PMI's PMP®); Senior = complex projects and people (IPMA Level B, APM's Chartered Project Professional).
These are the series’ teaching labels, not a declaration that the certifications are equivalent.
Read the transcript
Timed from the episode captions.
Open episode transcript
Sara: Welcome to Project Management Exam Prep.
This episode is about earned value, a calculation that every project management
exam can ask for.
Leo: One set of numbers shows whether you are on schedule and on budget,
and forecasts the final cost. You will learn the base numbers,
the ratios, the forecasts, and where the method misleads.
We finish with a calculation drill, so keep a pen and a calculator ready.
Sara: Let us start with the three lenses. What does IPMA® say?
Leo: IPMA®, the International Project Management Association, sets out its standard in
the Individual Competence Baseline, the ICB4.
Its element on finance counts earned value among its performance indicators.
You forecast from them, and report a coming cost breach through governance,
with a plan to fix it. Its element on plan and control names earned value analysis
as a skill.
Sara: And PMI®?
Leo: PMI®, the Project Management Institute, publishes the PMBOK® Guide,
its guide to the project management body of knowledge.
In the eighth edition, earned value is a tool for controlling finances.
The outline of PMI®'s Project Management Professional exam, the PMP®,
covers it in two tasks: plan and manage finance, and evaluate project status.
Sara: And APM?
Leo: APM, the Association for Project Management, publishes the APM Body of Knowledge.
It calls the method earned value analysis, one way to track spending and progress
together. The syllabus of APM's Project Management Qualification,
the PMQ, asks you to forecast and refine budgets with techniques such as earned
value.
Sara: Where do the words differ?
Leo: In two places. First, the plan you measure against.
PMI® calls it the performance measurement baseline, and APM the deployment baseline.
Sara: Second?
Leo: The drift you accept before someone acts.
PMI® sets control thresholds, APM speaks of tolerances, and the ICB4 asks you to
signal cost breaches.
Sara: What is the core, whichever exam you take?
Leo: Three ideas. One: measure progress in money.
Every piece of work gets a budget and a place in the schedule.
At each status date, ask what should be done, what is done, and what it cost.
Sara: Who decides what counts as done?
Leo: Credit rules, agreed in advance. For example, nothing is earned until a task is
finished, or half on starting and half on finishing.
Count work only when it is accepted: earned value says nothing about quality.
Sara: Two?
Leo: Compare, then ask why. The numbers show where you are behind or over.
The team tells you why.
Sara: And three?
Leo: Forecast, then act. A breach you forecast early can still be fixed.
Sara: And in agile work?
Leo: The unit changes. The PMBOK® Guide counts planned and earned value in story points,
iteration by iteration. APM notes that iterative teams often use burndown charts
instead.
Sara: The model sheet, free in the description, draws the three curves.
Leo: Planned value, or PV, is the budget of the work the plan expected by the status
date. Earned value, or EV, is the budget of the work really done.
Actual cost, or AC, is what that work cost.
The budget at completion, or BAC, is where planned value ends.
Sara: Give me numbers.
Leo: Take a ten-month project with a budget of nine hundred thousand euros.
At the end of month five, the plan expected four hundred and fifty thousand of work.
The work done is worth three hundred and sixty thousand, and it cost four hundred
thousand.
Sara: So where does it stand?
Leo: First, two variances. Schedule variance is EV minus PV: minus ninety.
Cost variance is EV minus AC: minus forty.
Below zero means behind schedule, or over budget.
Sara: And the indices?
Leo: The schedule performance index, the SPI, is EV divided by PV:
zero point eight. Only eighty percent of the planned work is done.
The cost performance index, the CPI, is EV divided by AC: zero point nine.
Each euro bought ninety cents of planned work.
Below one is bad news, and EV always comes first.
Sara: And the final cost?
Leo: That is the estimate at completion, the EAC.
There are four common formulas, one for each assumption.
Choose one, and say why.
Sara: First?
Leo: The efficiency so far continues: divide the BAC by the CPI.
Nine hundred divided by zero point nine is one million.
Sara: Second?
Leo: The overrun was a one-off, so the rest goes as planned.
Add the remaining budget, five hundred and forty, to the four hundred spent:
nine hundred and forty.
Sara: Third?
Leo: A fixed date pushes cost up too. Divide the remaining work by the CPI times the
SPI, zero point seven two. That gives seven hundred and fifty,
plus four hundred spent: one point one five million.
Sara: And fourth?
Leo: The plan no longer holds. Estimate the rest from the bottom up,
and use the formulas as a check.
Sara: What else?
Leo: EAC minus AC gives the estimate to complete: six hundred.
The variance at completion is BAC minus EAC: minus one hundred.
The to-complete performance index, the TCPI, divides the work left by the money
left. Five hundred and forty over five hundred is one point zero eight,
well above the CPI. Say so.
Sara: Can I trust the numbers?
Leo: Only as far as the baseline and the credit rules.
The SPI averages all the work, so check the critical path.
It also drifts back to one at the end, even on a late project.
Walt Lipke's earned schedule, from two thousand and three, measures the delay in
time instead.
Sara: How does this change between Mid-level and Senior?
Leo: First, the two levels. They are this series' own labels.
Mid-level means leading moderately complex projects, the level of IPMA® Level C and
PMI®'s PMP® exam. Senior means leading complex projects and people,
the level of IPMA® Level B and of APM's chartered status, Chartered Project Professional.
Take Parking Permits Online, a city project that moves resident parking permits
online in eight months. In month four, the project manager, Anna,
finds an SPI of zero point eight and a CPI of zero point nine six.
At Mid-level, she finds the causes with the team, and brings a forecast and options
to the steering group.
Sara: And at Senior level?
Leo: You design the measurement that others report into.
Take One City Account, a thirty-month city project that brings fourteen online services
under one login, led by Anna some years later.
Anna splits the baseline by service, so each gap has an owner.
Suppliers earn value only at accepted milestones.
The board agrees which variances reach it.
And she reports delays in weeks: a service that misses a quarterly release of the
national login waits three months.
Sara: Now the drill. A city is moving resident parking permits online,
with go-live at the end of month eight, weeks before January,
when most residents renew. At the end of month six, the budget at completion is
five hundred and seventy-six thousand euros.
Planned value is four hundred and eighty thousand, earned value four hundred and
thirty-two thousand, and actual cost four hundred and fifty thousand.
The team blames a one-off: cleaning old permit data.
A contingency of twenty-four thousand sits above that budget.
Where does it stand, and what is your forecast?
Leo: Pause and write your answer. You have forty-five seconds.
Sara: First, the status.
Leo: Schedule variance, minus forty-eight thousand; SPI, zero point nine.
Cost variance, minus eighteen thousand; CPI, zero point nine six.
Behind, and slightly over. The work left is five hundred and seventy-six minus four
hundred and thirty-two: one hundred and forty-four.
If the team is right, that work costs its budget.
Add the four hundred and fifty spent: five hundred and ninety-four,
inside the contingency. If not, divide the BAC by the CPI: six hundred,
the whole contingency.
Sara: Why does that shortcut work?
Leo: At a CPI of zero point nine six, the work left costs one hundred and fifty.
Add the four hundred and fifty spent: six hundred.
It always matches: the money spent is the work done divided by the CPI.
So test the one-off claim.
Sara: What lifts that to Senior?
Leo: Ninety-six of work was planned for the last two months, and one hundred and forty-four
remains. A failed January costs the city more than the contingency:
protect the date, and say why. Bring the steering group a range,
its assumptions and options. And welcome early bad news, so it keeps coming.
Sara: How do the exams ask this?
Leo: IPMA®'s exams ask for open answers. IPMA®'s certification also includes an interview,
where assessors ask about your own projects: note how you measured progress on one.
The PMP® exam uses scenarios, and questions built on a case study or a chart.
APM's PMQ asks for short written answers, such as how earned value refines a budget.
Sara: Let us recap.
Leo: One. Planned value, earned value and actual cost measure progress in money.
Sara: Two. Variances subtract, indices divide, and EV comes first.
Leo: Three. Four common formulas forecast the final cost.
Choose one by its assumption.
Sara: Four. The TCPI is the efficiency you now need.
Compare it with the CPI.
Leo: Five. The numbers are only as good as the baseline and the credit rules.
Sara: The model sheet on the three curves is free in the description.
Leo: So is the sheet with every formula, and the study handout.
Next time: NPV, IRR and payback.
Sources & further reading
Consult the original publications and authoritative references below. For certification requirements, use the current official documents. Edition-specific page references are included only when verified.
- IPMA® (2015). Individual Competence Baseline for Project, Programme and Portfolio Management, Version 4.0 (ICB4). Zurich: International Project Management Association. ISBN 978-94-92338-00-6 (print), 978-94-92338-01-3 (pdf). Free PDF from IPMA®: https://ipma.world/ipma-standards-development-programme/icb4/
- Project Management Institute (2025). A Guide to the Project Management Body of Knowledge (PMBOK® Guide), Eighth Edition, and The Standard for Project Management. Newtown Square, PA: PMI®. ISBN 9781628258295.
- Project Management Institute (2026). Project Management Professional (PMP®)® Examination Content Outline – 2026 (July 2026 exam update). Newtown Square, PA: PMI®. PDF on pmi.org, accessed 26 September 2026.
- Association for Project Management (2025). APM Body of Knowledge, 8th edition. Princes Risborough: APM. ISBN 9781913305390.
- Association for Project Management (2024, version 6 of April 2026). APM Project Management Qualification: Handbook. https://www.apm.org.uk/media/3r4jbodr/apm-project-management-qualification-handbook.pdf, and the PMQ page https://www.apm.org.uk/qualifications-and-training/project-management-qualification/, accessed 26 September 2026.
- IPMA® (2025). IPMA® International Certification Regulations (Public), Version 4.4, for the Assessment of Individuals in Project, Program & Portfolio Management. Zurich: International Project Management Association. https://ipma.world/app/uploads/2025/11/IPMA®-ICR-2025_v_4.4_digital.pdf, via https://ipma.world/ipma-certification/ipma-international-certification-regulations/, accessed 26 September 2026.
- Lipke, W. (2003, March). Schedule is different. The Measurable News (PMI® College of Performance Management), 31–34.
- Morris, P. W. G. (2013). Reconstructing Project Management. Chichester: Wiley-Blackwell. ISBN 9780470659076. https://doi.org/10.1002/9781118536698
Original and technical references for the related tools
- Walt Lipke: original earned-schedule papers
Walt Lipke introduced earned schedule in “Schedule Is Different” (2003).
- GAO: Cost Estimating and Assessment Guide
Standard estimating practice; the cited guide documents use rather than claiming invention.