8 minute read · Original practice exercise included
Before you start: Understand scope, schedule, cost and the approved baseline.
Read the lesson Explore tools and references
Next: Change control
Watch this lesson
Integrated planning and status reporting
Watch on YouTubeOpen the planning and control playlist
YouTube connects when you play a video or follow its links. Playback depends on the video’s availability on YouTube. Its own privacy and storage practices then apply. Voices are AI-generated.
Tools and references for this lesson
Use these resources to practise and extend the topic. Further applications may go beyond the lesson transcript; source pointers lead to the original author or publisher.
Calculators (1)
- Earned schedule
Translate earned value into equivalent baseline time. · Calculator + guide
Conceptual models (4)
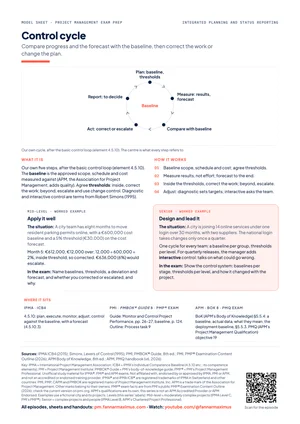
- Control cycle
Compare progress and the forecast with the baseline, then correct the work or change the plan. · Study sheet
- Earned value forecasting
Earned-value forecasts estimate final cost under stated assumptions about the efficiency of remaining work. Several forecasts can be useful precisely because their assumptions differ. · Guide
- Earned value: progress and cost
Earned value compares the budgeted value of completed work with planned work and actual cost at the same status date. · Guide
- Status report and RAG
Tell each level where the project stands, where it is heading and what to decide, in colours read the same way. · Study sheet
Formulas (8)
- Cost performance index
Measure the budgeted value earned per unit of actual cost. · Guide
- Cost variance
Compare the budgeted value of completed work with what that work actually cost. · Guide
- Estimate at completion
Forecast final cost assuming the cost efficiency observed so far continues. · Guide
- Estimate to complete
Separate forecast spending still to come from money already spent. · Guide
- Schedule performance index
Measure the amount of budgeted work earned relative to what was planned by the status date. · Guide
- Schedule variance
Compare completed work with the work planned by a status date, expressed in budget units. · Guide
- Variance at completion
Show the difference between the work budget and the forecast final cost. · Guide
- To-complete performance index
Calculate the cost efficiency required on the remaining work to finish within the original work budget. · Guide
Step-by-step methods (1)
- Build and challenge an earned-value forecast
First validate the baseline and actual costs. Then choose the forecast assumption that fits the remaining work, rather than the number that best fits the budget. · Calculator + guide
Further applications (2)
- Measuring physical completion
Define observable evidence for crediting completed work. · Guide
- Variance thresholds and trends
Set explicit triggers for investigating a departure from an agreed baseline. · Guide
Check your understanding
A status report is green even though a key milestone is forecast late. What should you check?
Show answer and reasoning
Check the reporting date, evidence, agreed thresholds and forecast assumptions. Report the exception and the decision needed rather than choosing a colour to preserve confidence.
Apply the same reasoning to your own example. State one assumption you would need to check.
Chapters
Jump to the corresponding passage in the transcript.
Study materials
Open the original practice sheet · print or save as PDF
Anki package not yet available.
Key terms
The series’ own explanations. Official sources and edition pointers are below.
- Integrated project management plan
- One plan that joins scope, schedule, cost, resources, risk, quality and communication, and checks that they agree. APM abbreviates it PMP®, which is not PMI®'s exam.
- Baseline
- The approved version of scope, schedule and cost (APM adds quality) that progress is measured against. PMI®: performance measurement baseline; APM: deployment baseline.
- Control cycle
- Plan, measure, compare, act, report. Inside the agreed thresholds you correct the work; beyond them you escalate and change the plan through change control.
- RAG status
- Red, amber or green, each tied to a threshold agreed before the first report. PMI® shows them as stoplight charts in dashboards; APM speaks of traffic lights.
- Exception report
- A report sent between the regular ones as soon as a forecast will break an agreed limit, with the cause, the options and a recommendation.
- Leading and lagging indicators
- Lagging indicators show what has happened, such as work done or money spent. Leading ones warn early, such as open defects or blocked work. PMI®'s guide names both.
About the lesson’s level labels
Levels (this series' labels): Mid-level = moderately complex projects (IPMA Level C, PMI's PMP®); Senior = complex projects and people (IPMA Level B, APM's Chartered Project Professional).
These are the series’ teaching labels, not a declaration that the certifications are equivalent.
Read the transcript
Timed from the episode captions.
Open episode transcript
Sara: Welcome to Project Management Exam Prep.
This episode is about integrated planning and status reporting:
one plan whose parts agree, and reports that tell the truth about it.
Every project management exam tests it.
Leo: You will learn how the three bodies frame it, what the plan joins up,
what a baseline is, how control works, and how to report status.
We finish with a drill, so keep a pen ready.
Sara: Let us start with the three lenses. What does IPMA® say?
Leo: IPMA®, the International Project Management Association, sets out its standard in
the Individual Competence Baseline, the ICB4.
Its element on plan and control joins all the parts in one balanced plan,
controlled against a baseline and reported with a forecast.
Its element on organisation and information adds who reports what,
to whom.
Sara: And PMI®?
Leo: PMI®, the Project Management Institute, publishes the PMBOK® Guide,
its guide to the project management body of knowledge.
In the eighth edition, one governance process aligns the plans,
and another monitors performance. The outline of PMI®'s Project Management Professional
exam, the PMP®, has two tasks here: develop an integrated plan,
and evaluate project status.
Sara: And APM?
Leo: APM, the Association for Project Management, publishes the APM Body of Knowledge.
Its section on integrated planning aims to show stakeholders that the business case
can be met. The syllabus of APM's Project Management Qualification,
the PMQ, has an objective with the same name: know what the plan contains,
and why it matters.
Sara: Where do the words differ?
Leo: In two places. First, the plan's short name.
APM writes PMP® for the project management plan.
For PMI®, PMP® means its certification and exam.
Sara: And second?
Leo: The baseline. PMI® calls the scope, schedule and cost baselines together the performance
measurement baseline. APM's deployment baseline adds quality,
and is approved at the gate before the main work starts.
The ICB4 simply says baseline.
Sara: What is the core, whichever exam you take?
Leo: Three ideas. One: the plan is one plan.
Scope, schedule, cost, resources, risk, quality and communication are often written
by different people. Integration checks that they agree.
Does every work package have dates and people?
Do the risk responses have money and time?
Does each board decision have a report?
A plan whose parts contradict each other is not a plan.
Sara: Two?
Leo: The baseline is the approved version you measure against, usually scope,
schedule and cost. It shows each deviation, and it stops anyone moving the target
quietly. It changes only through change control.
Sara: Does that change in agile work?
Leo: A linear project fixes a detailed baseline before the build.
An iterative one baselines less: the iterations, the team, the budget and the key
functions. The detail grows each iteration.
Sara: And three?
Leo: Measure progress honestly. A task reported as ninety percent done can stay there
for weeks: people judge the part that is left too kindly.
So measure results, not effort. Use milestones with a clear check,
such as ‘all links pass their tests’. Count work only when it is accepted,
and in iterative work, only what users saw working at the review.
Add leading indicators, such as open defects, which warn before dates slip.
PMI®'s guide contrasts them with lagging ones, such as money spent.
Sara: Now the models. Both model sheets are free in the description.
Leo: The first is our own control cycle, after the basic loop in the ICB4.
Plan: agree the baselines, the thresholds for action and the reporting rhythm.
Measure: collect progress where the work is done, and forecast to the end.
Earned value, which has its own episode, measures progress in money.
Compare: actuals and forecast against the baseline.
Act: inside your thresholds, correct the work, and the baseline stays.
Beyond them, escalate, and change the plan through change control.
Report: give each level what it must decide.
Sara: Is that all?
Leo: One more turn: adjust the control itself.
The ICB4 names two kinds, terms from the management scholar Robert Simons.
Diagnostic control checks results against targets set in advance.
Interactive control, for high uncertainty, adds regular talks with the team about
what could make the plan wrong.
Sara: And the second model?
Leo: The status report. First agree what goes to whom, how often and in what form.
Reports run both ways: from team leads to you, and from you to the sponsor and the
board.
Sara: What goes on the page?
Leo: Five things. The status now, against the baseline.
A forecast to the end. The trend since the last report.
The top risks and issues, with owners. And the decisions needed,
with dates. Without a forecast, a report only tells history.
Sara: And the colours?
Leo: Red, amber and green, or RAG. The PMBOK® Guide shows them as stoplight charts.
APM's Body of Knowledge speaks of traffic lights.
Neither fixes their meaning. So set thresholds before the first report.
Our convention: green, the forecast meets the baseline.
Amber, it misses, but you can recover within your tolerance, the limit the board
delegated to you. Red, the forecast breaks that tolerance, so someone above you
decides. A colour is then a request, not a mood.
Sara: And between reports?
Leo: When a forecast will break a limit, send an exception report at once,
with options. With an experienced team, the ICB4 accepts reporting only by exception.
Sara: And dashboards?
Leo: A dashboard puts several measures on one screen.
An information radiator is a board where the team works, updated by hand.
Both are only as honest as their measures.
Sara: How does this change between Mid-level and Senior?
Leo: First, the two levels. They are this series' own labels.
Mid-level means leading moderately complex projects, the level of IPMA® Level C and
PMI®'s PMP® exam. Senior means leading complex projects and people,
the level of IPMA® Level B and of APM's chartered status, Chartered Project Professional.
At Mid-level, you keep one plan and report it honestly.
Take Parking Permits Online, a city project that moves resident parking permits
online in eight months. The project manager, Anna, baselines the scope,
the go-live date and the budget with the steering group.
She reports on one page every two weeks, under colour rules agreed at the start.
Sara: And at Senior level?
Leo: You design the system that others plan and report in.
Take One City Account, a thirty-month city project that brings fourteen online services
under one login, led by Anna some years later.
Anna keeps a baseline for each group of services.
Every team and both suppliers report into one page for the steering board,
under one set of colour rules. And nobody is blamed for an amber,
so problems surface early.
Sara: Now the drill. A city is moving resident parking permits online,
and go-live is due before January, when most residents renew.
A supplier builds ten screens in five two-week timeboxes.
After three timeboxes, its report says the screens are eighty-five percent complete,
and every report was green. That figure averages the developers' own estimates.
Only three screens have passed the city's acceptance tests, and the plan expected
six. What is the real status, and what do you change?
Leo: Pause and write your answer. You have forty-five seconds.
Sara: First, the numbers.
Leo: Eighty-five percent measures how finished the work feels.
By results, three of ten screens is thirty percent.
The plan expected sixty percent. So the pace is half the plan:
one screen a timebox, not two.
Sara: And the forecast?
Leo: At half the pace, the build takes twice as long.
Ten screens at one a timebox take ten timeboxes.
The plan had five, so the build ends ten weeks late.
Testing and training move too, so go-live misses January.
It is rough, but it rests on results.
Sara: And then?
Leo: It is red: far beyond your limits. Send an exception report to the steering group
now, with options: build first the screens the renewals need,
add supplier capacity, or move go-live and keep the counters open.
Then fix the measure: count only accepted screens.
Sara: What lifts that to Senior?
Leo: Treat it as a fault in the reporting system.
The colour rules had no threshold on results, so green hid the slip.
Write the measure into the reporting rules and the contract.
Give the board trade-offs against what the renewals can tolerate.
And thank the team for the bad news, so the next one arrives early.
Sara: How do the exams ask this?
Leo: IPMA®'s exams ask for open answers. IPMA®'s certification also includes an interview,
where assessors ask about your own projects, so note one report that changed a decision.
The PMP® exam uses scenarios, and questions built on a case study or a chart:
practise reading a dashboard. APM's PMQ asks for short written answers,
such as what an integrated plan contains.
Sara: Let us recap.
Leo: One. The integrated plan joins every part, and checks that the parts agree.
Sara: Two. The baseline is what you measure against.
It changes only through change control.
Leo: Three. Plan, measure, compare, act and report.
Correct the work inside your thresholds; escalate beyond them.
Sara: Four. Measure results, not effort: accepted work, milestones with a check,
and leading indicators.
Leo: And five. Report a forecast and the decisions needed, with colours tied to thresholds
agreed in advance.
Sara: The two model sheets and the study handout are linked in the description.
Next time: change control.
Sources & further reading
Consult the original publications and authoritative references below. For certification requirements, use the current official documents. Edition-specific page references are included only when verified.
- IPMA® (2015). Individual Competence Baseline for Project, Programme and Portfolio Management, Version 4.0 (ICB4). Zurich: International Project Management Association. ISBN 978-94-92338-00-6 (print), 978-94-92338-01-3 (pdf). Free PDF from IPMA®: https://ipma.world/ipma-standards-development-programme/icb4/
- Project Management Institute (2025). A Guide to the Project Management Body of Knowledge (PMBOK® Guide), Eighth Edition, and The Standard for Project Management. Newtown Square, PA: PMI®. ISBN 9781628258295.
- Project Management Institute (2026). Project Management Professional (PMP®)® Examination Content Outline – 2026 (July 2026 exam update). Newtown Square, PA: PMI®. PDF on pmi.org, accessed 26 September 2026.
- Association for Project Management (2025). APM Body of Knowledge, 8th edition. Princes Risborough: APM. ISBN 9781913305390.
- Association for Project Management (2024, version 6 of April 2026). APM Project Management Qualification: Handbook. https://www.apm.org.uk/media/3r4jbodr/apm-project-management-qualification-handbook.pdf, and the PMQ page https://www.apm.org.uk/qualifications-and-training/project-management-qualification/, accessed 26 September 2026.
- Simons, R. (1995). Levers of Control: How Managers Use Innovative Control Systems to Drive Strategic Renewal. Boston: Harvard Business School Press. ISBN 9780875845593.
- IPMA® (2025). IPMA® International Certification Regulations (Public), Version 4.4, for the Assessment of Individuals in Project, Program & Portfolio Management. Zurich: International Project Management Association. https://ipma.world/app/uploads/2025/11/IPMA®-ICR-2025_v_4.4_digital.pdf, via https://ipma.world/ipma-certification/ipma-international-certification-regulations/, accessed 26 September 2026.
Original and technical references for the related tools
- Walt Lipke: original earned-schedule papers
Walt Lipke introduced earned schedule in “Schedule Is Different” (2003).
- GAO: Cost Estimating and Assessment Guide
Standard estimating practice; the cited guide documents use rather than claiming invention.