8 minute read · Original practice exercise included
Before you start: Use the same scope and units for all estimates.
Read the lesson Explore tools and references
Next: Earned value
Watch this lesson
Estimation
Watch on YouTubeOpen the methods playlist
YouTube connects when you play a video or follow its links. Playback depends on the video’s availability on YouTube. Its own privacy and storage practices then apply. Voices are AI-generated.
Tools and references for this lesson
Use these resources to practise and extend the topic. Further applications may go beyond the lesson transcript; source pointers lead to the original author or publisher.
Conceptual models (2)
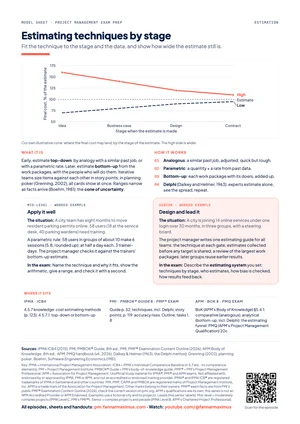
- Estimating techniques by stage
Fit the technique to the stage and the data, and show how wide the estimate still is. · Study sheet
- Three-point estimate (PERT)
Replace a single guess with a range: an expected value and a spread that show how sure the estimate is. · Study sheet
Formulas (1)
- Three-point estimation
Use optimistic, most likely and pessimistic estimates to make uncertainty explicit. · Guide
Step-by-step methods (1)
- Estimate with a range
Discuss distinct scenarios before calculating a weighted average. The explanation for the range is often more useful than the middle number. · Calculator + guide
Further applications (3)
- Analogous and parametric estimating
Use comparable historical work or a defensible quantity-rate relationship to estimate new work. · Guide
- Estimate maturity and uncertainty
Explain how scope definition, evidence and estimation method affect the confidence in an estimate. · Guide
- Software size and effort estimation
Keep product size, team-relative effort and elapsed duration distinct. · Guide
Original framework and research sources (1)
- Reference class forecasting
Challenge an estimate using outcomes from a defensibly comparable class of completed projects. · Source pointer
Check your understanding
Optimistic, most likely and pessimistic durations are 2, 5 and 14 days. What is the PERT-style mean?
Show answer and reasoning
(2 + 4 × 5 + 14) ÷ 6 = 6 days. The triangular mean is 7 days. Both depend on assumptions and neither is a guaranteed finish date.
Apply the same reasoning to your own example. State one assumption you would need to check.
Chapters
Jump to the corresponding passage in the transcript.
Study materials
Open the original practice sheet · print or save as PDF
Anki package not yet available.
Key terms
The series’ own explanations. Official sources and edition pointers are below.
- Analogous, parametric and bottom-up
- Estimating from a similar past job; from a quantity times a rate from past data; from each work package, added up. APM also says comparative (analogous) and analytical (bottom-up).
- Three-point estimate
- Optimistic (O), most likely (M) and pessimistic (P) values. Triangular mean (O + M + P) ÷ 3; PERT mean (O + 4M + P) ÷ 6. PMI®'s guide says multipoint estimating.
- Standard deviation (SD)
- The spread of an estimate. PERT's shortcut is (P − O) ÷ 6. For a chain of independent activities, square the SDs, add them, and take the square root.
- Cone of uncertainty
- The range of an estimate is wide early and narrows as facts arrive (Boehm, 1981; named by McConnell, 1997). APM calls it the estimating funnel.
- Story points and planning poker
- Story points: relative sizes of work items. Planning poker: each member picks a card in private, all show at once, and the highest and lowest explain before the team votes again.
- Basis of estimates
- PMI®'s name for the record behind an estimate: its assumptions, constraints, level of detail, range and confidence. APM stresses recording the assumptions.
About the lesson’s level labels
Levels (this series' labels): Mid-level = moderately complex projects (IPMA Level C, PMI's PMP®); Senior = complex projects and people (IPMA Level B, APM's Chartered Project Professional).
These are the series’ teaching labels, not a declaration that the certifications are equivalent.
Read the transcript
Timed from the episode captions.
Open episode transcript
Sara: Welcome to Project Management Exam Prep.
This episode is about estimating time, cost and resources.
Every project management exam tests it.
Leo: A single number hides how unsure an estimate is.
You will learn the main techniques, why early estimates are wide,
the three-point formulas, and the traps.
We finish with a calculation drill, so keep a pen and a calculator ready.
Sara: Let us start with the three lenses. What does IPMA® say?
Leo: IPMA®, the International Project Management Association, sets out its standard in
the Individual Competence Baseline, the ICB4.
Estimating sits in three of its elements: time, for effort and duration;
finance, for costs; and resources, for the type, amount and quality needed.
Sara: And PMI®?
Leo: PMI®, the Project Management Institute, publishes the PMBOK® Guide,
its guide to the project management body of knowledge.
In the eighth edition, it is a step in building the schedule and a process in the
finance domain. The outline of PMI®'s Project Management Professional exam,
the PMP®, asks you to estimate effort and contingency, and to size tasks,
including in story points.
Sara: And APM?
Leo: APM, the Association for Project Management, publishes the APM Body of Knowledge.
It places estimation inside integrated planning.
The syllabus of APM's Project Management Qualification, the PMQ,
asks why you re-estimate through the life cycle.
Sara: Where do the words differ?
Leo: In three places. First, APM gives two techniques second names:
analogous is also comparative, and bottom-up is also analytical.
Second, PMI®'s guide calls three-point estimating multipoint estimating.
Third, the way estimates narrow over time: APM calls it the estimating funnel,
and many writers the cone of uncertainty.
Sara: What is the core, whichever exam you take?
Leo: Three ideas. One: an estimate is a forecast, not a promise.
So give a range, and write down what it assumes.
PMI® calls that record the basis of estimates.
For APM, the assumptions feed risk and contingency planning.
Sara: Two?
Leo: Ask the people who will do the work, one by one.
Then estimate again as facts arrive.
Sara: And three?
Leo: Watch four traps. Anchoring: the first number anyone hears pulls every estimate
towards it, as Amos Tversky and Daniel Kahneman showed in nineteen seventy-four.
Optimism: we picture the work going well.
Padding: hidden safety, which the work uses up.
And effort taken for duration: ten person-days take a half-time person twenty working
days. Put safety on top, in the open: contingency for known risks,
and a management reserve for the unknown, as the episodes on cost and risk explain.
Sara: And in agile work?
Leo: Teams often size items in story points, relative to each other:
comparing is easier than predicting hours.
In planning poker, from James Grenning in two thousand and two,
each member picks a card in private, and all show at once, so nobody anchors the
others. Those at the extremes explain first.
Sara: Now the techniques. The model sheet, free in the description,
compares them.
Leo: Four are common. Analogous: a similar past job, adjusted for the differences.
Quick and rough: for the early stages. Parametric: a quantity times a rate from
past data. Forty screens at three hours of testing each make one hundred and twenty
hours.
Sara: And the other two?
Leo: Bottom-up: estimate each work package with the people who will do it,
then add them up: slow but detailed. And expert judgement in rounds.
In the Delphi method, published by Norman Dalkey and Olaf Helmer in nineteen sixty-three,
experts answer alone, see the spread without names, and answer again.
Check any estimate with a second technique.
Sara: How exact can an early estimate be?
Leo: Not very. Barry Boehm showed in nineteen eighty-one that the range starts wide and
narrows as facts arrive. Steve McConnell named it the cone of uncertainty.
Our own illustrative ranges are on screen.
At the idea stage, the final cost may land thirty percent below the estimate,
or sixty percent above. At the contract stage, five percent below,
or ten above. The high side is wider, because overruns tend to exceed savings.
Sara: And the three-point estimate?
Leo: Ask for three values: optimistic, most likely and pessimistic.
Say testing a new online form takes eight days at best, eleven most likely,
and twenty at worst. The triangular mean is the plain average:
thirty-nine divided by three, thirteen days.
Sara: And PERT?
Leo: PERT, the program evaluation and review technique, comes from a United States Navy
programme, described by Malcolm and colleagues in nineteen fifty-nine.
It assumes a lopsided curve, called a beta curve, and counts the most likely value
four times. Four times eleven is forty-four.
Add eight and twenty: seventy-two. Divide by six, because the weights add up to
six: twelve days. Both means sit above eleven, because the worst case lies further
out, and the triangular mean weights it more.
Sara: And the spread?
Leo: PERT assumes the best and worst cases lie about three standard deviations either
side of the mean. So one standard deviation is a sixth of the range.
Here, the range is twelve days, so the deviation is two.
For a chain, add the means, but never the standard deviations.
Square them, add the squares, and take the square root.
Take deviations of three and four days.
Together they make five, not seven, if the activities are independent.
Sara: And sixty-eight and ninety-five percent?
Leo: One standard deviation either side of the mean covers about sixty-eight percent
of outcomes. Two cover about ninety-five.
That assumes a bell curve. One lopsided activity fits it only roughly;
a chain of independent activities comes closer.
And it is only as honest as the worst case.
Sara: How does this change between Mid-level and Senior?
Leo: First, the two levels. They are this series' own labels.
Mid-level means leading moderately complex projects, the level of IPMA® Level C and
PMI®'s PMP® exam. Senior means leading complex projects and people,
the level of IPMA® Level B and of APM's chartered status, Chartered Project Professional.
Take Parking Permits Online, a city project that moves resident parking permits
online in eight months. The project manager, Anna, estimates the city's own work
bottom-up, with the people who will do it.
For uncertain work, such as moving the old permit data, she asks for three points.
The steering group gets ranges, not single dates.
Sara: And at Senior level?
Leo: You design how others estimate. Take One City Account, a thirty-month city project
that brings fourteen online services under one login, led by Anna some years later.
Anna writes one estimating guide for every team: the technique at each gate,
and estimates collected before any target is shared.
The board chooses how sure it wants to be, and funds the gap as contingency.
Sara: Now the drill. A city team is moving resident parking permits online,
and go-live must come before January, when most residents renew.
On the critical path, the supplier must link the service to the national e-ID,
the login residents use. At the kick-off, the sponsor said the plan allows twenty
working days, and the supplier's lead agreed.
Then the supplier's developers, asked separately, give fourteen days at best,
twenty most likely, and thirty-eight at worst.
What do you tell the steering group?
Leo: Pause and write your answer. You have forty-five seconds.
Sara: First, the numbers.
Leo: Triangular: seventy-two divided by three, twenty-four days.
PERT: four times twenty is eighty. Add fourteen and thirty-eight:
one hundred and thirty-two. Divided by six, twenty-two days.
The standard deviation: thirty-eight minus fourteen is twenty-four.
A sixth of that is four days.
Sara: So are twenty days enough?
Leo: Twenty is the most likely value, but not a likely one: the long tail pulls the mean
to twenty-two. On PERT's assumptions, twenty days are enough about one time in three.
Add one deviation to the mean: twenty-six days.
That is enough about eight times in ten.
Why? Sixty-eight percent fall within one deviation, so only about sixteen percent
lie above. Ask what drives the thirty-eight: often one risk you can respond to.
Then give the steering group the range, its assumptions and a date.
Sara: What lifts that to Senior?
Leo: The sponsor's twenty anchored the lead, so collect estimates before anyone hears
a target. January cannot move, so the steering group chooses the confidence level.
Hold the six extra days as one visible buffer before go-live,
not as padding in each task. And if the same developers build other links at once,
their overruns move together: the real range is wider.
Sara: How do the exams ask this?
Leo: IPMA®'s exams ask for open answers. IPMA®'s certification also includes an interview,
where assessors ask about your own projects: note an estimate that proved wrong.
The PMP® exam uses scenarios, and questions built on a case study or a chart.
APM's PMQ asks for short written answers, such as why you re-estimate.
Sara: Let us recap.
Leo: One. An estimate is a forecast: give a range and its assumptions.
Sara: Two. Choose the technique by stage and data, and check it with a second.
Leo: Three. Triangular: the plain average. PERT: count the most likely four times,
and divide by six. The standard deviation: a sixth of the range.
Sara: Four. Sixty-eight and ninety-five percent assume a bell curve,
honest worst cases and independent work.
Leo: Five. Watch anchoring, optimism, padding, and effort taken for duration.
Keep safety visible.
Sara: The two model sheets and the study handout are free in the description.
Next time: earned value.
Sources & further reading
Consult the original publications and authoritative references below. For certification requirements, use the current official documents. Edition-specific page references are included only when verified.
- IPMA® (2015). Individual Competence Baseline for Project, Programme and Portfolio Management, Version 4.0 (ICB4). Zurich: International Project Management Association. ISBN 978-94-92338-00-6 (print), 978-94-92338-01-3 (pdf). Free PDF from IPMA®: https://ipma.world/ipma-standards-development-programme/icb4/
- Project Management Institute (2025). A Guide to the Project Management Body of Knowledge (PMBOK® Guide), Eighth Edition, and The Standard for Project Management. Newtown Square, PA: PMI®. ISBN 9781628258295.
- Project Management Institute (2026). Project Management Professional (PMP®)® Examination Content Outline – 2026 (July 2026 exam update). Newtown Square, PA: PMI®. PDF on pmi.org, accessed 26 September 2026.
- Association for Project Management (2025). APM Body of Knowledge, 8th edition. Princes Risborough: APM. ISBN 9781913305390.
- Association for Project Management (2024, version 6 of April 2026). APM Project Management Qualification: Handbook. https://www.apm.org.uk/media/3r4jbodr/apm-project-management-qualification-handbook.pdf, and the PMQ page https://www.apm.org.uk/qualifications-and-training/project-management-qualification/, accessed 26 September 2026.
- Association for Project Management (2025, version 5 of April 2026). APM Project Fundamentals Qualification: Handbook. https://www.apm.org.uk/media/kcjbezhz/apm-project-fundamentals-qualification-handbook.pdf, and the PFQ page https://www.apm.org.uk/qualifications-and-training/project-management-fundamentals/, accessed 26 September 2026.
- IPMA® (2025). IPMA® International Certification Regulations (Public), Version 4.4, for the Assessment of Individuals in Project, Program & Portfolio Management. Zurich: International Project Management Association. https://ipma.world/app/uploads/2025/11/IPMA®-ICR-2025_v_4.4_digital.pdf, via https://ipma.world/ipma-certification/ipma-international-certification-regulations/, accessed 26 September 2026.
- Malcolm, D. G., Roseboom, J. H., Clark, C. E. & Fazar, W. (1959). Application of a technique for research and development program evaluation. Operations Research, 7(5), 646–669.
- Dalkey, N. & Helmer, O. (1963). An experimental application of the Delphi method to the use of experts. Management Science, 9(3), 458–467. https://doi.org/10.1287/mnsc.9.3.458
- Boehm, B. W. (1981). Software Engineering Economics. Englewood Cliffs, NJ: Prentice-Hall. ISBN 9780138221225.
- McConnell, S. (1997). Software Project Survival Guide. Redmond, WA: Microsoft Press. ISBN 9781572316218.
- Tversky, A. & Kahneman, D. (1974). Judgment under uncertainty: Heuristics and biases. Science, 185(4157), 1124–1131. https://doi.org/10.1126/science.185.4157.1124
- Flyvbjerg, B. & Gardner, D. (2023). How Big Things Get Done. New York: Currency. ISBN 9780593239513.
- Grenning, J. (2002, April). Planning Poker or How to Avoid Analysis Paralysis while Release Planning. Renaissance Software Consulting. https://wingman-sw.com/papers/PlanningPoker-v1.1.pdf. Planning Poker® is a registered trademark of Mountain Goat Software, LLC; this series is not affiliated with it.
Original and technical references for the related tools
- GAO: Cost Estimating and Assessment Guide
Standard estimating practice; the cited guide documents use rather than claiming invention.