9 minute read · Original practice exercise included
Before you start: Distinguish process behaviour from specification requirements.
Watch this lesson
Quality tools
Watch on YouTubeOpen the methods playlist
YouTube connects when you play a video or follow its links. Playback depends on the video’s availability on YouTube. Its own privacy and storage practices then apply. Voices are AI-generated.
Tools and references for this lesson
Use these resources to practise and extend the topic. Further applications may go beyond the lesson transcript; source pointers lead to the original author or publisher.
Calculators (3)
- Pareto counts and cumulative share
Rank recorded problem categories to focus investigation. · Calculator + guide
- Defect density and removal efficiency
Track observed defects on a consistent measurement boundary. · Calculator + guide
- Process capability: Cp and Cpk
Compare a stable process’s spread and centring with specification limits. · Calculator + guide
Conceptual models (3)
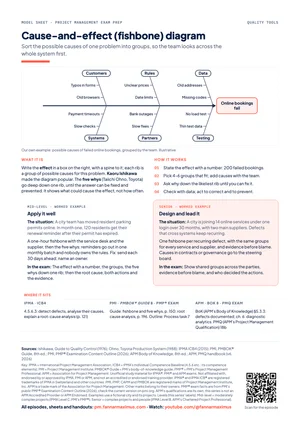
- Cause-and-effect (fishbone) diagram
Sort the possible causes of one problem into groups, so the team looks across the whole system first. · Study sheet
- Control chart
Tell normal variation from a real signal over time, so you act on special causes and change the process for the rest. · Study sheet
- Pareto chart
Rank the causes of a problem by count, so the team fixes first the vital few that produce most of the effect. · Study sheet
Further applications (2)
- Cost of quality
Compare the cost of preventing and detecting errors with the consequences of failures. · Guide
- Statistical process control
Distinguish routine process variation from signals that merit investigation. · Guide
Original framework and research sources (2)
- Plan–Do–Study–Act
Connect a small test with evidence and a deliberate learning decision. · Source pointer
- EFQM Model
Find an organisational assessment approach for improvement work. · Source pointer
Check your understanding
Every observation is within the specification limits. Does that prove the process is statistically stable?
Show answer and reasoning
No. Specifications describe requirements; control limits describe expected process variation. Examine the time-ordered observations for signals and investigate their causes using appropriate process evidence.
Apply the same reasoning to your own example. State one assumption you would need to check.
Chapters
Jump to the corresponding passage in the transcript.
Study materials
Key terms
The series’ own explanations. Official sources and edition pointers are below.
- Cause-and-effect diagram and five whys
- A fishbone (Ishikawa) diagram sorts the possible causes of one effect into groups. The five whys go deep down one group, until the answer is a cause you can fix and prevent.
- Pareto chart
- Bars for the causes of a problem, the largest first, with a line of their cumulative share, so the vital few stand out. ‘80/20’ is a rule of thumb (after Juran).
- Control limits
- The mean of a stable period plus and minus three standard deviations, by a common convention. They show what the process does, not what is required.
- Common and special cause variation
- Common cause: the normal noise of a stable process; change the process to reduce it. Special cause: something changed, signalled by a point outside the limits or a run of seven.
- Specification limits
- The limits the requirements set. PMI®: specification limits; APM: acceptance criteria; the ICB4: target values for quality indicators. They are not control limits.
- Root cause analysis
- Finding the underlying cause of a defect, so that fixing it stops the defect coming back. The ICB4 and PMI® use this name; APM files it under diagnostic analytics.
About the lesson’s level labels
Levels (this series' labels): Mid-level = moderately complex projects (IPMA Level C, PMI's PMP®); Senior = complex projects and people (IPMA Level B, APM's Chartered Project Professional).
These are the series’ teaching labels, not a declaration that the certifications are equivalent.
Read the transcript
Timed from the episode captions.
Open episode transcript
Sara: Welcome to Project Management Exam Prep.
This episode is about quality tools: finding the causes of a problem,
ranking them, and watching a process over time.
Leo: Every project management exam can ask for them.
You will learn four tools, and how to choose between them.
Quality planning, assurance and the cost of quality have their own episode.
We finish with a drill, so keep a calculator ready.
Sara: Let us start with the three lenses. What does IPMA® say?
Leo: IPMA®, the International Project Management Association, sets out its standard in
the Individual Competence Baseline, the ICB4.
Its element on quality asks you to find defects with established tools,
analyse their causes, and explain a root-cause analysis.
Its element on resourcefulness adds analytic techniques for causes and trends.
Sara: And PMI®?
Leo: PMI®, the Project Management Institute, publishes the PMBOK® Guide,
its guide to the project management body of knowledge.
The eighth edition lists the cause-and-effect diagram, the five whys and control
charts among its tools. The outline of PMI®'s Project Management Professional exam,
the PMP®, asks you to plan quality processes and tools, and to improve continuously.
Sara: And APM?
Leo: APM, the Association for Project Management, publishes the APM Body of Knowledge.
There, quality control documents and remedies defects, and continuous improvement
starts from performance data. The syllabus of APM's Project Management Qualification,
the PMQ, asks how quality control techniques show whether success criteria are met.
Sara: Where do the words differ?
Leo: In two places. First, the search for causes.
The ICB4 and the PMBOK® Guide say root cause analysis.
APM's chapter on data files it under diagnostic analytics: why did it happen?
Sara: Second?
Leo: The limit a requirement sets. PMI® says specification limit, APM acceptance criterion,
and the ICB4 target value for a quality indicator.
None of them is a control limit.
Sara: What is the core, whichever exam you take?
Leo: Choose the tool by the question. One: why does it happen?
A cause-and-effect diagram goes wide, and the five whys go deep.
Two: which problem first? A Pareto chart ranks the causes.
Three: is the process stable, or has something changed?
A control chart tells noise from a signal.
Always put data before opinion: count before you fix, and after.
Sara: And in agile work?
Leo: A team can draw a quick fishbone in a retrospective, or count why items came back
from testing. APM names retrospectives among the tools of continuous improvement.
The PMBOK® Guide also puts cost and schedule variances on control charts.
Sara: Where do I start?
Leo: With the effect, as a fact with a number.
Take a new online booking service: in its first month, two hundred bookings fail.
Write it in a box on the right, with a spine to it.
Each rib holds a group of possible causes, filled in by the team.
Kaoru Ishikawa, a Japanese quality pioneer, made this fishbone diagram popular.
Sara: And the five whys?
Leo: They go deep, down one rib, as Taiichi Ohno, the engineer behind Toyota's production
system, described. Why do bookings fail?
The payment step times out. Why? It waits for an address check.
Why is that slow? It calls an outside service for every booking.
And why was that not caught? Nobody tested at peak load.
So speed up the check, and add a load test to every release: one corrective action,
and one preventive.
Sara: Which rib matters most?
Leo: Count. A fishbone shows what could cause the effect, not how often.
Joseph Juran applied the Pareto idea to quality in nineteen fifty-one:
a vital few causes produce most of the losses.
He named it after the economist Vilfredo Pareto, and later called the name his mistake.
One bar per cause, the largest first. Timeouts: ninety.
Rejected addresses: fifty. Declined cards: thirty.
Three small causes: thirty.
Sara: And the line?
Leo: The running total, as a share. Ninety of two hundred is forty-five percent.
Add fifty: seventy. Add thirty: eighty-five.
That is three causes of six, so eighty-twenty, the idea that a fifth of the causes
give four fifths of the effect, is only a rule of thumb.
Fix where the line bends.
Sara: The fix is live. How do I know it holds?
Leo: With a control chart, which Walter Shewhart set out in nineteen thirty-one.
Plot one measure over time, with its mean.
By a common convention, the control limits sit three standard deviations either
side of the mean of a stable period. Say failed bookings now average ten a day,
and the standard deviation is two. Three times two is six.
So the limits are sixteen and four.
Sara: What does it tell me?
Leo: Which variation to leave alone. Points between the limits are common cause variation,
the normal noise. Chasing them adds noise.
A point outside signals a special cause: something changed, so find it.
On day eleven, eighteen bookings fail: the payment partner had changed a setting
that morning.
Sara: And inside the limits?
Leo: Watch for runs. A common rule of thumb, the rule of seven: seven consecutive points,
all above the mean or all below it. From day fourteen, seven days sit above ten.
All are inside the limits, but the process has shifted.
Sara: Why seven?
Leo: In a stable process, each point is a coin toss, above or below the mean.
Seven heads in a row is one half, seven times over.
That is one chance in a hundred and twenty-eight.
Sara: So inside the limits is good enough?
Leo: Not always. Control limits come from the data; specification limits,
from the requirements. Here the service level allows at most thirteen failures a
day, below the upper limit of sixteen. So a stable process can still miss it.
Then change the process.
Sara: How does this change between Mid-level and Senior?
Leo: First, the two levels. They are this series' own labels.
Mid-level means leading moderately complex projects, the level of IPMA® Level C and
PMI®'s PMP® exam. Senior means leading complex projects and people,
the level of IPMA® Level B and of APM's chartered status, Chartered Project Professional.
Take Parking Permits Online, a city project that moves resident parking permits
online in eight months. After go-live, the project manager, Anna,
has the service desk log each problem with one cause.
She ranks the causes, runs the five whys with the supplier, and watches one control
chart through January, when most residents renew.
Sara: And at Senior level?
Leo: You design how many parties measure and react.
Take One City Account, a thirty-month city project that brings fourteen online services
under one login, led by Anna some years later.
Anna agrees one list of defect causes for every service and both main suppliers,
so their charts compare. Each key measure has agreed signals,
an owner and a time to react. The steering board sees trends,
not single bad days.
Sara: Now the drill. A city moved resident parking permits online four weeks ago,
ahead of January, when most residents renew.
Each day, the team counts residents who give up an online renewal before paying.
Over twenty working days, the mean is fifteen a day, and the standard deviation
is two. The steering group's target is at most twelve.
Yesterday, twenty gave up, and the sponsor wants the supplier to explain it by tomorrow.
Is yesterday a signal? What do you do?
Leo: Pause and write your answer. You have forty-five seconds.
Sara: First, the chart.
Leo: Three times the standard deviation of two is six.
So the limits are nine and twenty-one. Twenty is inside: common cause.
Unless there is a run of seven, chasing yesterday wastes the supplier's time.
But the target of twelve is below the mean of fifteen.
The process is stable, but misses the target on most days.
Sara: Why most days?
Leo: In a stable process, about half the days fall above the mean.
Twelve is below it, so even more days miss.
Only a change to the process moves the mean.
So use a Pareto chart of where residents give up, the five whys on the tallest bar,
and a new control chart for the new mean.
Sara: What lifts that to Senior?
Leo: January brings far more renewals, so chart the share who give up,
not the count. Agree in advance with the steering group which signals start action,
who acts, and how fast. Put the target in the supplier's service level.
Weigh a fix before January against extra staff through it.
And treat common cause variation as the system's problem, not a person's fault.
Sara: How do the exams ask this?
Leo: IPMA®'s exams ask for open answers. IPMA®'s certification also includes an interview,
where assessors ask about your own projects: note one root cause you found,
and your evidence. The PMP® exam uses scenarios, and questions built on a case study
or a chart. APM's PMQ asks for short written answers, such as how quality control
shows that success criteria are met.
Sara: Let us recap.
Leo: One. Choose the tool by the question.
Sara: Two. The fishbone goes wide; the five whys go deep.
Leo: Three. A Pareto chart ranks the causes; the cumulative line shows the vital few.
Sara: Four. A point outside the control limits, or seven consecutive points above or below
the mean, signals a special cause.
Leo: Five. Control limits are not specification limits.
Stable but off target? Change the process.
Sara: The three model sheets and the study handout are free in the description.
Next time: agile planning and metrics.
Sources & further reading
Consult the original publications and authoritative references below. For certification requirements, use the current official documents. Edition-specific page references are included only when verified.
- IPMA® (2015). Individual Competence Baseline for Project, Programme and Portfolio Management, Version 4.0 (ICB4). Zurich: International Project Management Association. ISBN 978-94-92338-00-6 (print), 978-94-92338-01-3 (pdf). Free PDF from IPMA®: https://ipma.world/ipma-standards-development-programme/icb4/
- Project Management Institute (2025). A Guide to the Project Management Body of Knowledge (PMBOK® Guide), Eighth Edition, and The Standard for Project Management. Newtown Square, PA: PMI®. ISBN 9781628258295.
- Project Management Institute (2026). Project Management Professional (PMP®)® Examination Content Outline – 2026 (July 2026 exam update). Newtown Square, PA: PMI®. PDF on pmi.org, accessed 26 September 2026.
- Association for Project Management (2025). APM Body of Knowledge, 8th edition. Princes Risborough: APM. ISBN 9781913305390.
- Association for Project Management (2024, version 6 of April 2026). APM Project Management Qualification: Handbook. https://www.apm.org.uk/media/3r4jbodr/apm-project-management-qualification-handbook.pdf, and the PMQ page https://www.apm.org.uk/qualifications-and-training/project-management-qualification/, accessed 26 September 2026.
- IPMA® (2025). IPMA® International Certification Regulations (Public), Version 4.4, for the Assessment of Individuals in Project, Program & Portfolio Management. Zurich: International Project Management Association. https://ipma.world/app/uploads/2025/11/IPMA®-ICR-2025_v_4.4_digital.pdf, via https://ipma.world/ipma-certification/ipma-international-certification-regulations/, accessed 26 September 2026.
- Ishikawa, K. (1976). Guide to Quality Control. Tokyo: Asian Productivity Organization. ISBN 9789283310358.
- Ohno, T. (1988). Toyota Production System: Beyond Large-Scale Production. Cambridge, MA: Productivity Press. ISBN 9780915299140.
- Juran, J. M. (ed.) (1951). Quality-Control Handbook, 1st ed. New York: McGraw-Hill.
- Juran, J. M. (1975). The non-Pareto principle; mea culpa. Quality Progress, 8(5), 8–9. Reprinted by the Juran Institute: https://www.juran.com/wp-content/uploads/2021/03/The-Non-Pareto-Principle-1974.pdf, accessed 27 September 2026.
- Shewhart, W. A. (1931). Economic Control of Quality of Manufactured Product. New York: D. Van Nostrand. Reprint: Milwaukee, WI: American Society for Quality Control, 1980, ISBN 9780873890762.
- Kerzner, H. (2013). Project Management: A Systems Approach to Planning, Scheduling, and Controlling, 11th ed. Hoboken, NJ: Wiley. ISBN 9781118022276.
Original and technical references for the related tools
- NIST: process capability
Standard process-capability indices. This implementation uses the published mathematical definitions without copying diagrams.
- NIST/SEMATECH: statistical methods
Standard mathematical statistics; the handbook is an authoritative technical reference, not a claim of sole origin.
- GAO: Cost Estimating and Assessment Guide
Standard estimating practice; the cited guide documents use rather than claiming invention.
- NIST: control charts
Walter A. Shewhart developed statistical control charts. NIST is a later technical reference, not their inventor.